
Tiny hiccups, caught before they become outages.
Monitor sites, APIs, and certificates with calm alerts, clean status pages, and a dashboard your team will actually read.
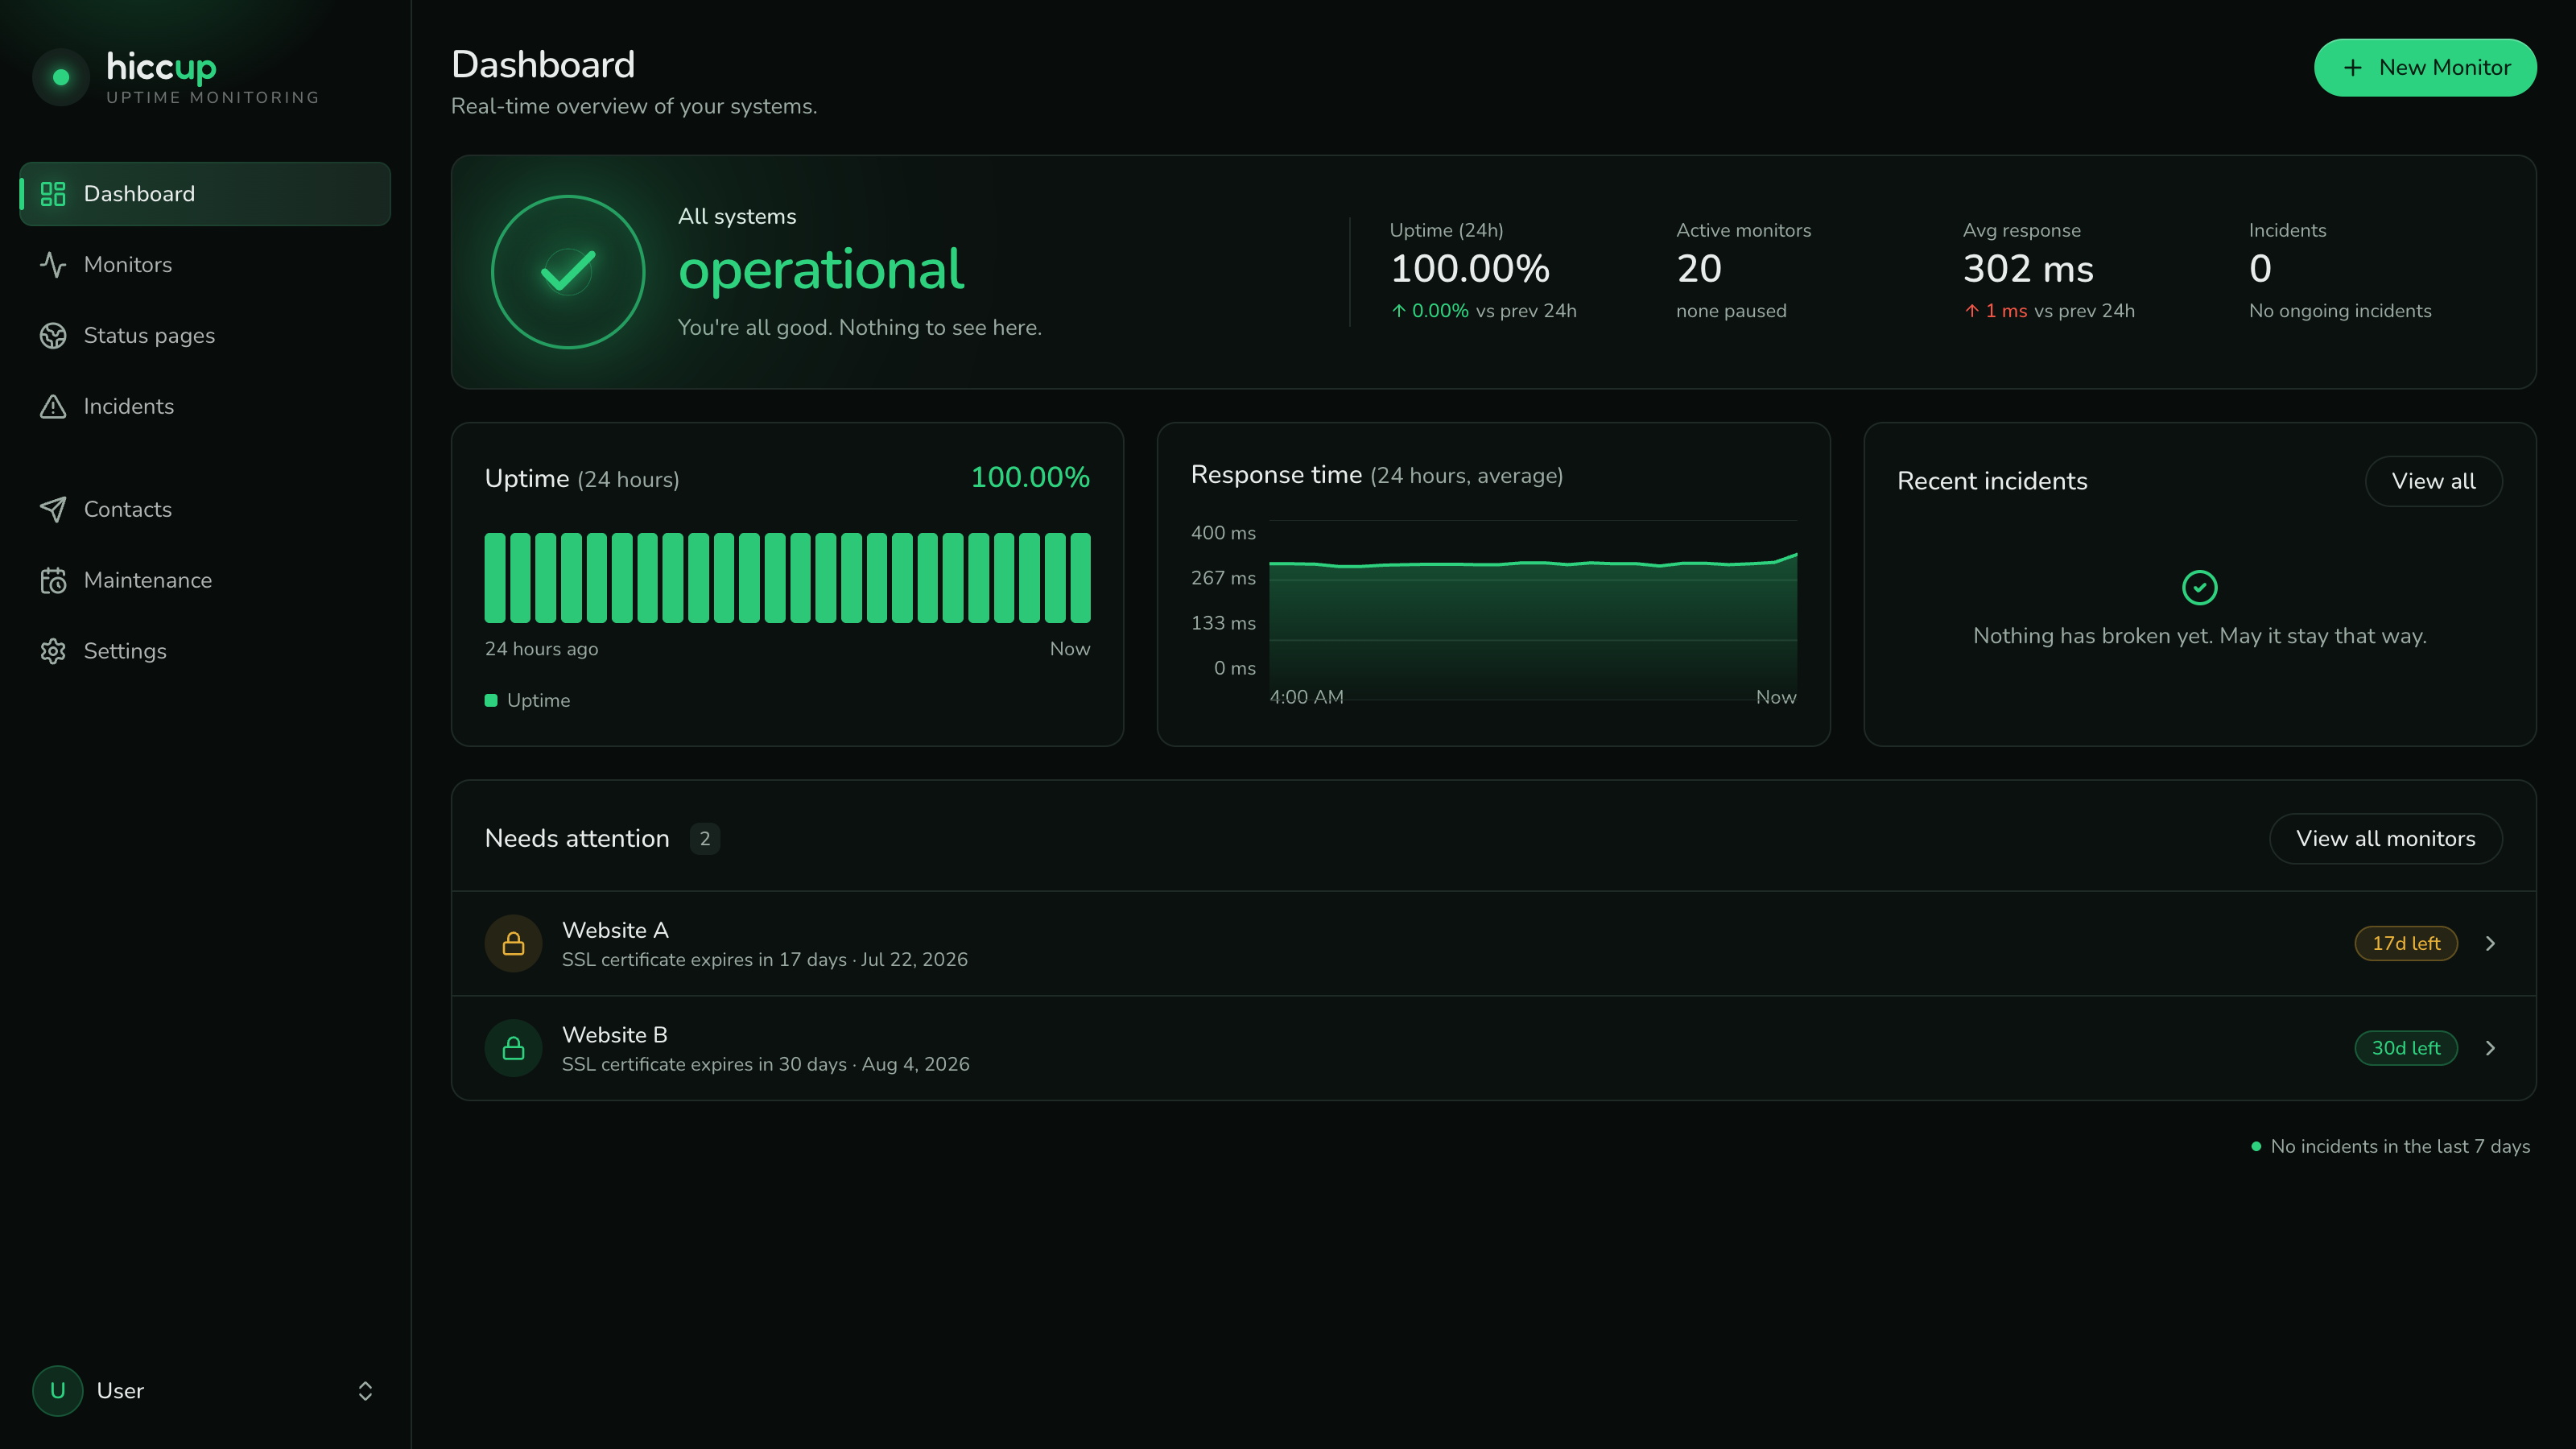
Built for the small failures that break trust
The essentials are grouped around the way incidents actually unfold: detect, verify, alert, and communicate.
One place for the signals your team needs at 2 AM.
Checks, incidents, and public updates share the same source of truth, so the dashboard tells the same story your customers see.
Uptime checks
HTTP, TCP, and heartbeat monitors with clear up/down history.
Retries, timing, and clear state changes
API monitors
Validate status codes, response bodies, and latency thresholds.
Headers, content, and latency rules
Certificate expiry
Catch TLS certificates before they expire and break trust.
Early warnings with renewal windows
Public status pages
Branded pages your customers can read during an incident.
Clean history and current component state
Incident communication
Updates that feel calm while the system is not
The incident view is built for quick triage first, then clear public communication once there is something useful to say.
Checkout API latency
Investigating · 2 affected monitors
Incident resolved
Today, 09:14api.example.com is responding normally again.
Elevated response times
Today, 08:52Monitoring checkout latency after a deploy.
Scheduled maintenance
Yesterday, 22:00Database migration completed without downtime.
Certificate renewed
Mon, 14:30SSL for shop.example.com renewed automatically.
Public status
UpdatingLatest customer update
We are seeing elevated API latency and are investigating the affected monitor.

Keep the next hiccup small.
Start with one monitor, invite the right people, and publish a status page before the next outage writes the story for you.